While the Reports tab on the Store Manager provides sales data on your products, Analytics shows the number of views you receive on your store and the origin of the views. It basically provides you with an idea how visitors find your store and your products.
An example is the number of clicks on a Facebook page that sends the visitor to your store on DushiMart to view a product you are promoting on Facebook. Another example is an article you wrote about a product or a coupon for a product.
Analytics will show you how many people clicked on the link in the article to view the product or coupon you wrote about in your article. Information you are able to view include:
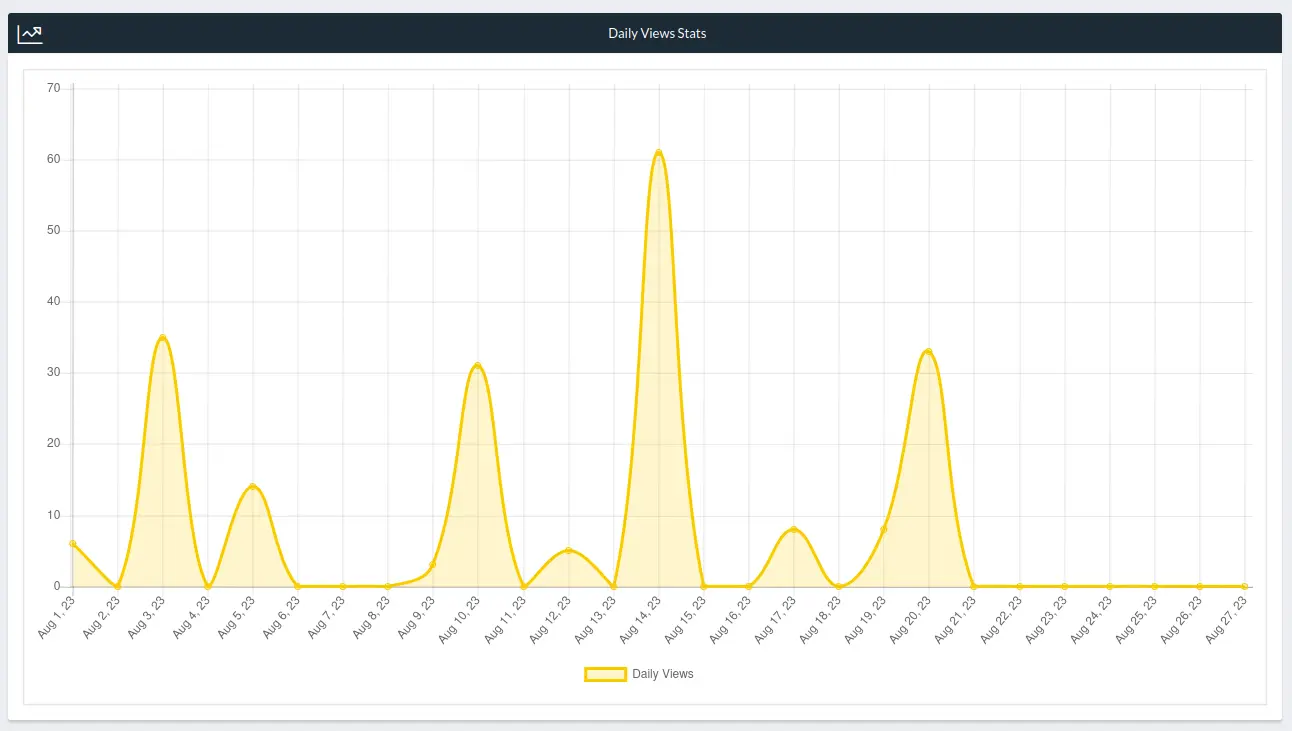
The number of Daily Views your store receives:
The Top Referrer URL’s that send the viewers to your store and the most viewed products displayed in a pie graph: 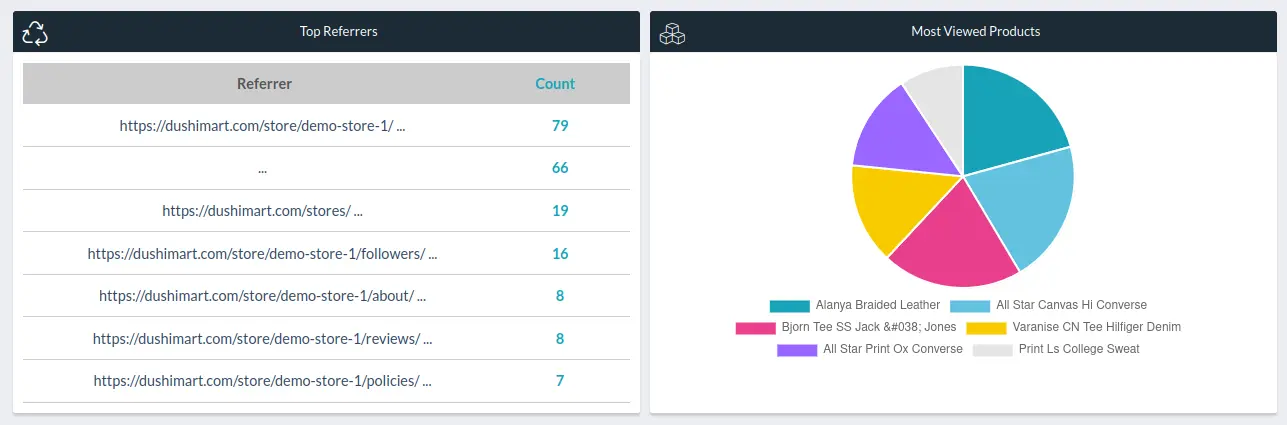
The number of views per product per day, per week, per month or any specified date range: 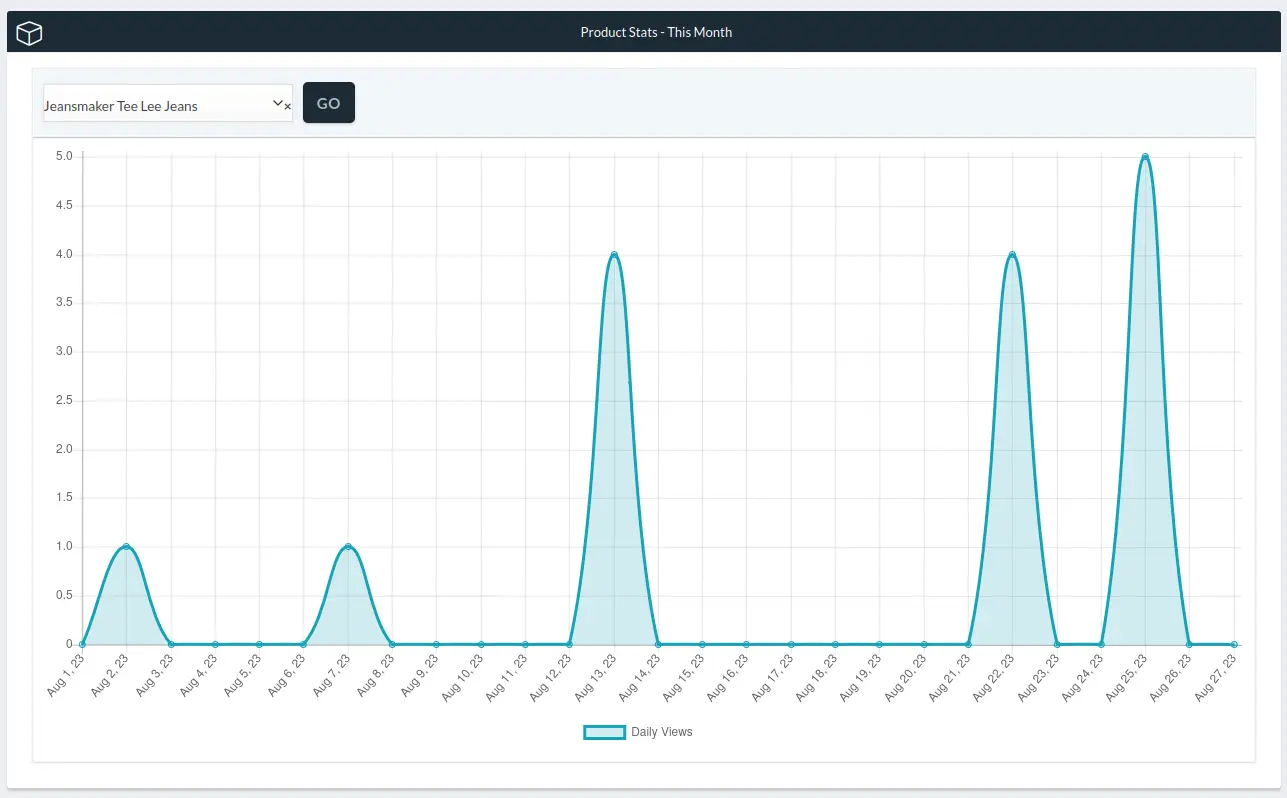
The number of views per product category per day, per week, per month or any specified date range:  analitica graficos grafieken